Power BI: Top Tips to Avoid Data Overload
Having a wealth of data at your fingertips is great, but what happens when your data is so vast that it takes you years to make a key discovery?
A friend of mine told me a story recently about an experience he had. His first company conducted a VP meeting every quarter – everyone scrambling to put together their presentations and make their case based on the data from Excel spreadsheets.
Departments and information tended to be segmented into silos. While much of the data could be shared across the company, rarely was it compiled in a way to show how one area of the business could affect another.

My friend vividly recalled one VP meeting where the owner stood up from looking at the spreadsheets and announced, “Well there it is! We’ve thought our problem with collections were due to salespeople being dishonest but right here we can trace the problem back to when we raised our prices and forced a larger product on the customer. ”
That was a great insight that could have helped the company change course, but unfortunately, the company made the connection 3 years too late.
What insights are you missing due to data being kept in Excel spreadsheets or disjointed data repositories without the option for cross analysis?
While Excel does a great job of recording and sorting data, we all know the limitations including:
- Too much data, which Excel doesn’t handle well
- Analysis takes too much time and introduces the element of human error
- Limited scope of analysis;
- Inventory analysis, production data, and sales data are in separate folders and not integrated; typically only get value summaries
Now think about your ugliest spreadsheet - want to make it seamless and automated but not sure how?
Microsoft Power BI solves these issues by serving as a combined data warehouse, calculation engine, presentation and data visualization tool. When done right, Power BI solutions let you query data sources, clean and load data to create reliable and immediate calculations, summarizations, and visualizations.
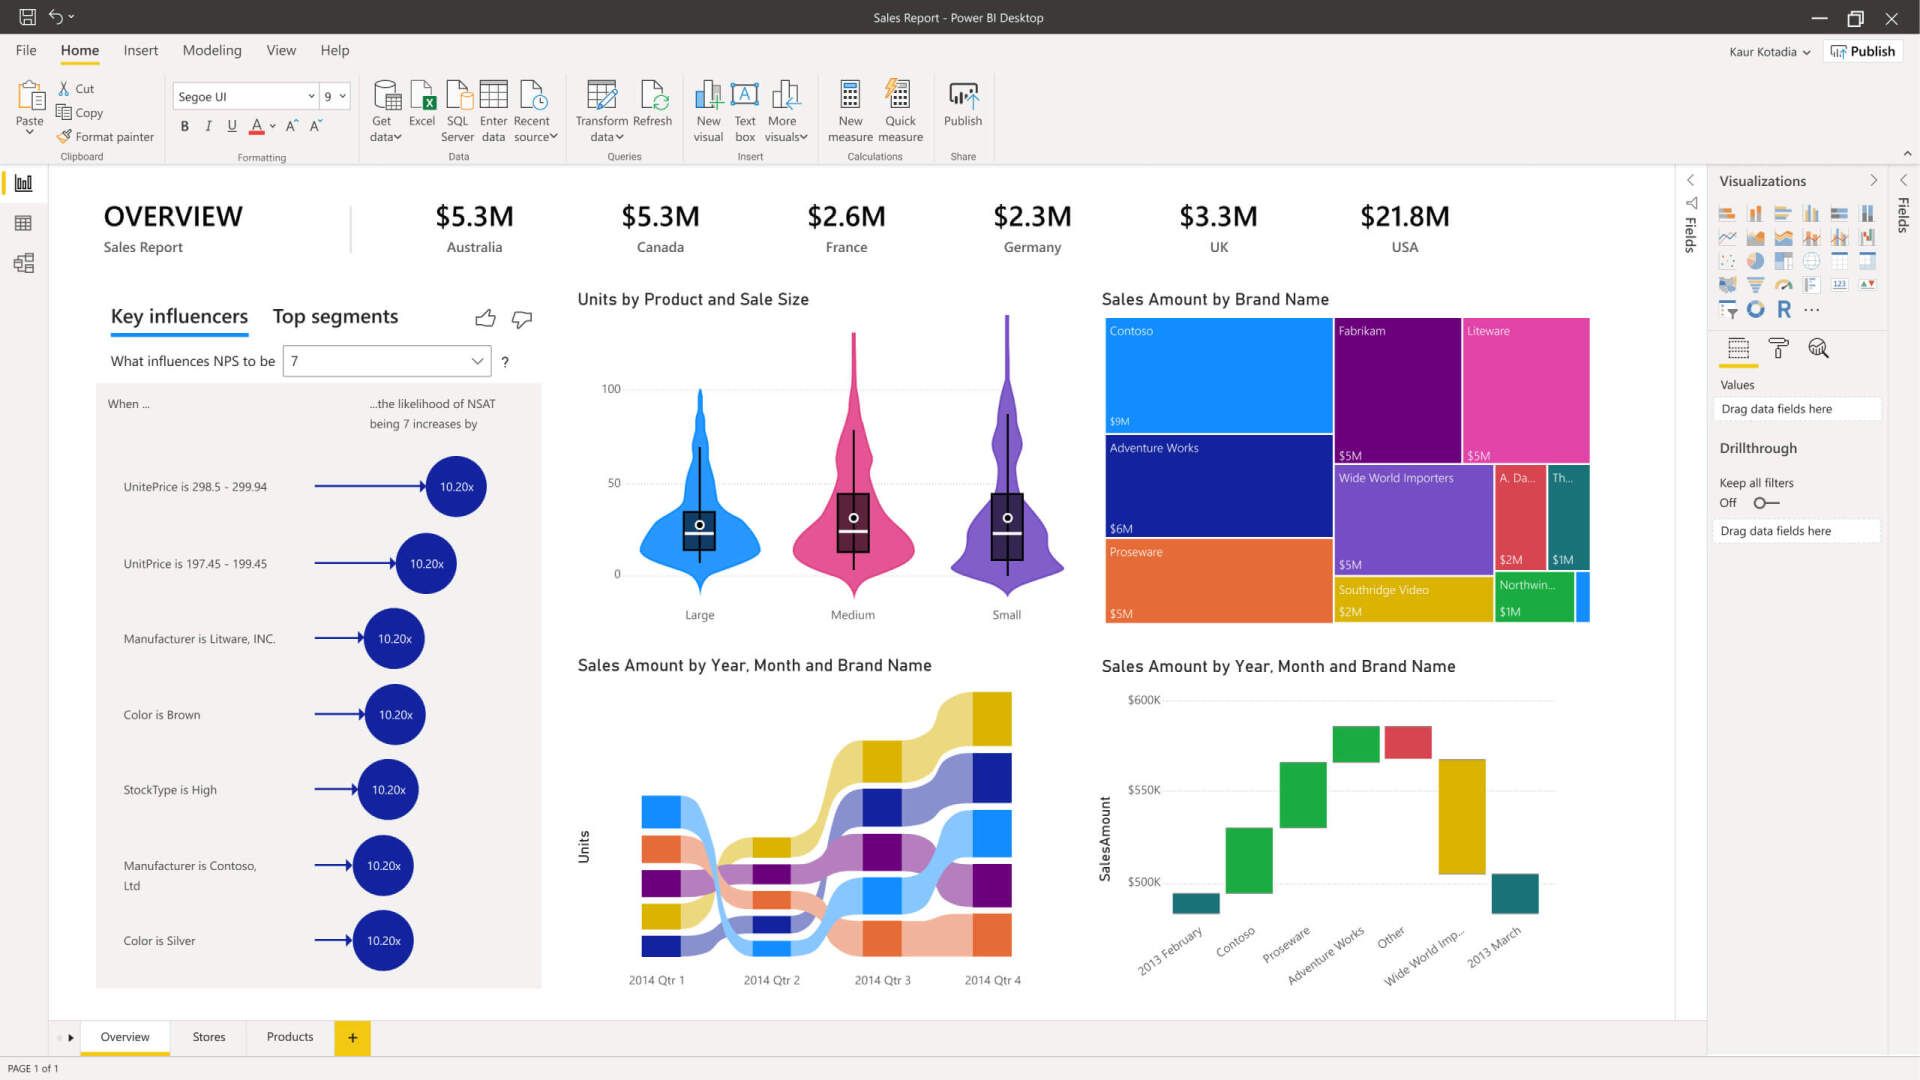
Key Benefits of Power BI:
Create Custom User and Role Based Dashboards
Share and Read Reports Easily
Work with Large Data Sets Efficiently
Here’s our top tips to get you started in Power BI:
- Use the right tool for the right job - understand when and why to use Power BI rather than legacy tools like Excel
- Integrate with live connections to your data - get rid of the manual export and import, along with inadvertent changes (errors) - pull it straight from the source into an automated consistent report
- Breakdown Silos - show data from scattered systems in one visually compelling and easy-to-process report to identify trends and relationships
- Empower access to your data from anywhere - who here has tried to open an excel document on their cell phone? Power BI has a mobile app and is mobile friendly
- Get training / start now - the first step is the hardest and that is starting. You can use your Excel knowledge to relate to Power BI formulas which are written in DAX
Want to learn how you can make your data work for you? Ready to go further? Let's talk for 15 minutes.